Fourteen modules. Every finding carries the number it deviates from.
The analytics portal is the thing a Medicare Advantage plan actually buys. Risk adjustment, Star Ratings, medical loss ratio, utilization, membership, claims and encounter submission, with a dashboard that leads with findings, not figures.
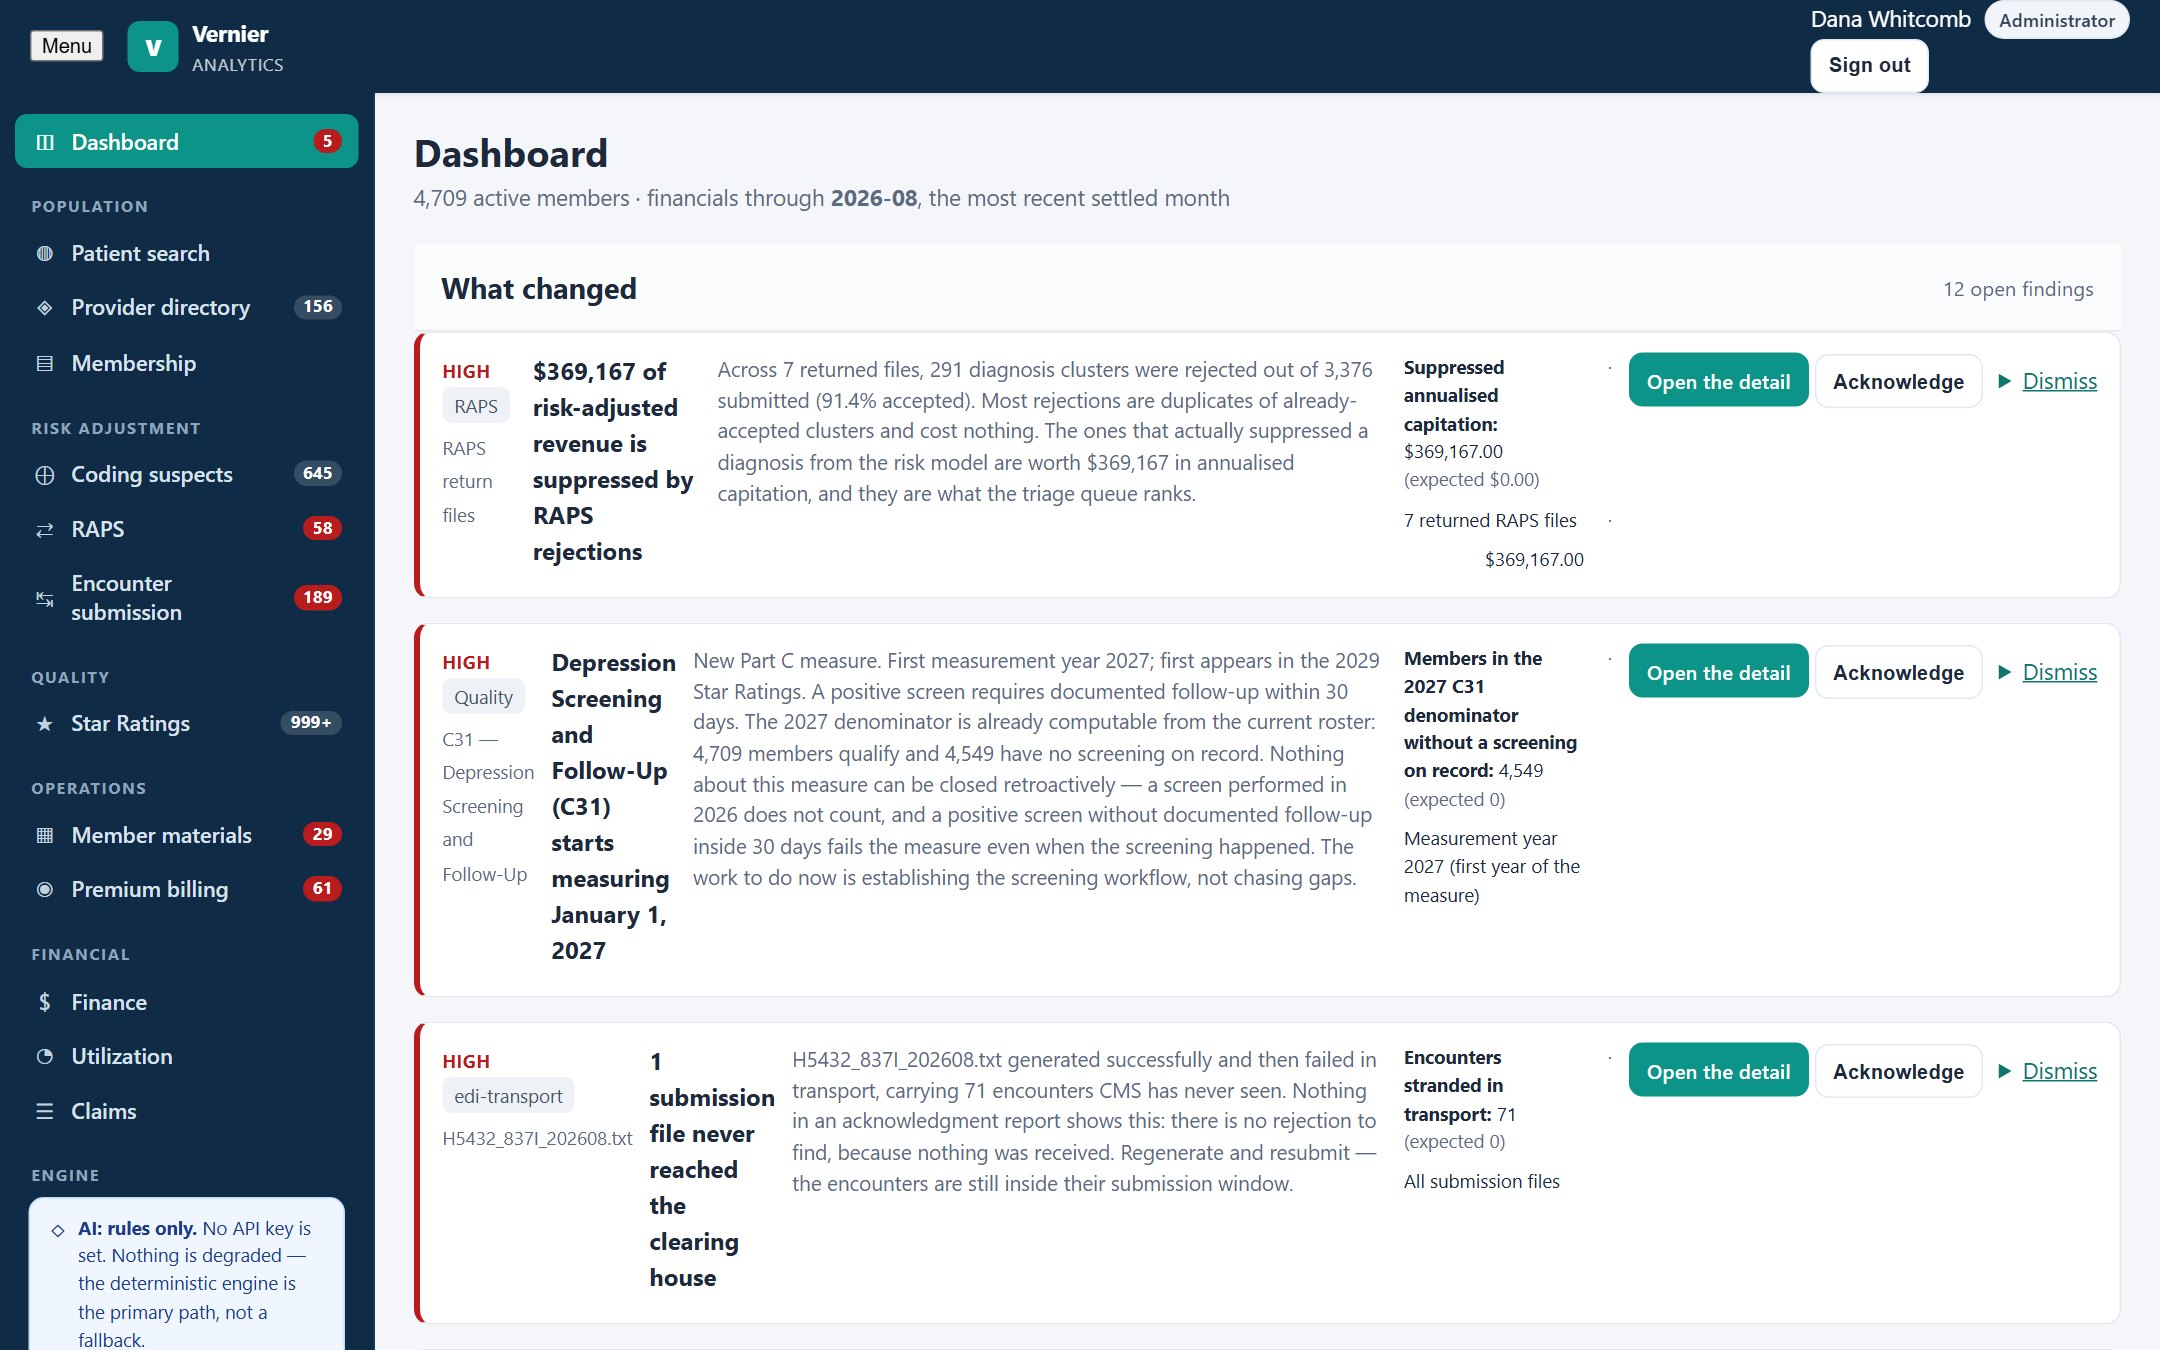
What the plan sees.
An actuary in the room can add up the detail and get the header.
The demo population is deterministic. The same seed produces the same 5,000 members, the same 400 full clinical histories and the same roughly 91,000 records every time, in front of every prospect. No random numbers anywhere in the seed path.
An automated suite asserts 41 properties of that population before anyone sees it: book-level loss ratio lands in range, cost concentration is realistic, every member's profile header equals the sum of their own claims, every coding suspect's evidence resolves, C31 appears only in 2027, RAPS dollar impact ranks correctly, every NPI passes the check digit.
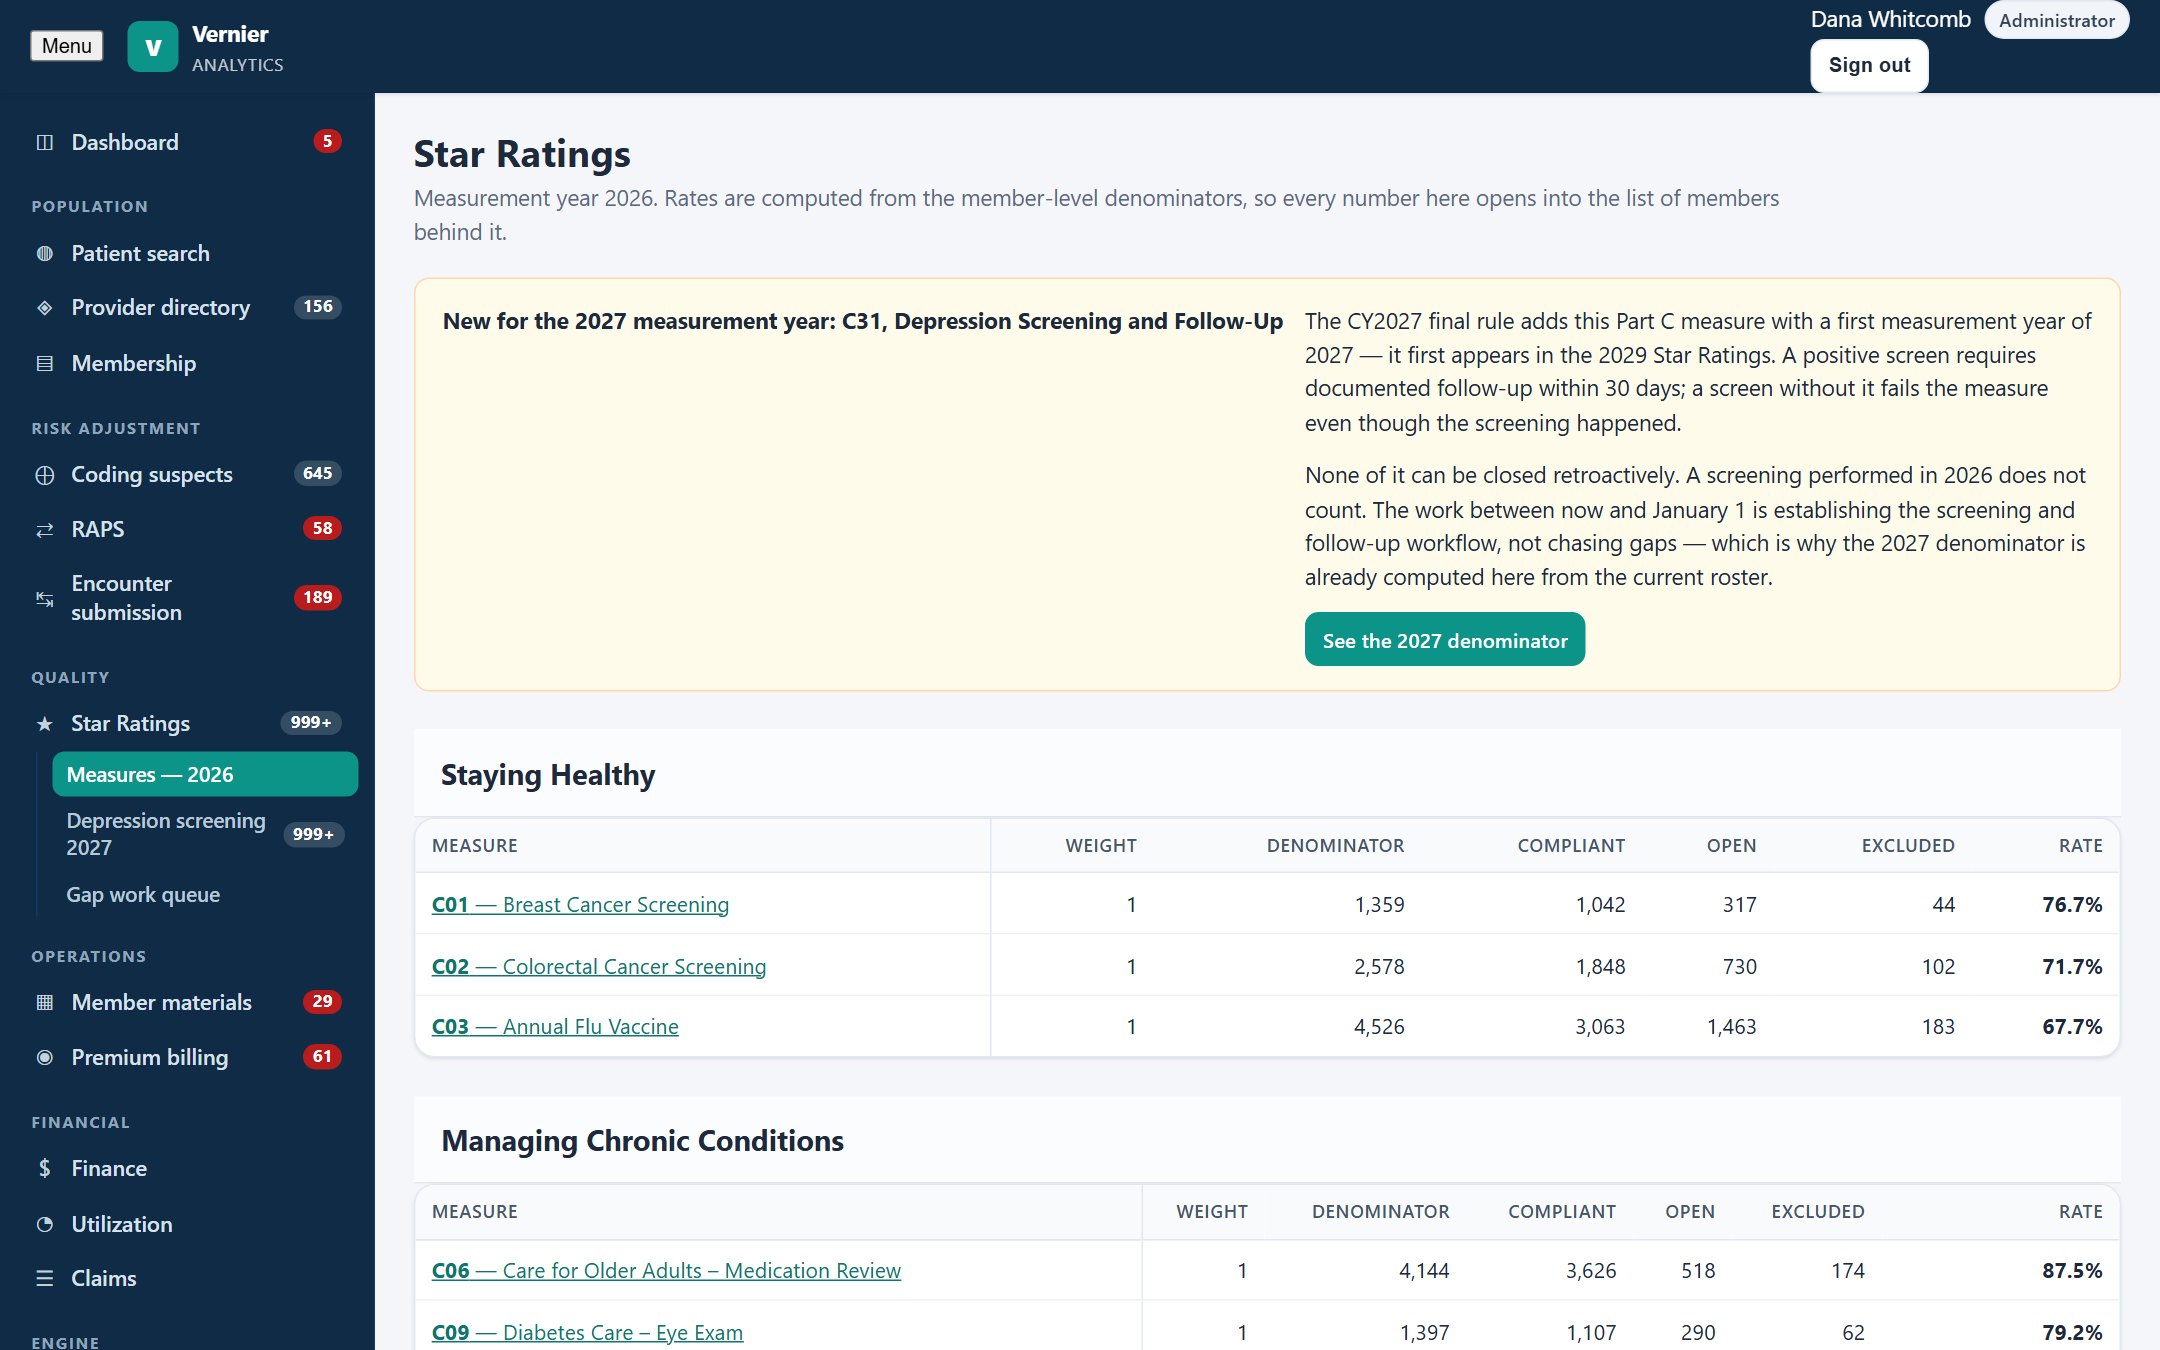
Rules compute the answer. The model rewrites the sentence.
Every finding, narrative and churn score is computed from rules first. With a language model configured, the wording of findings and MLR narratives is rewritten for clarity. Numbers, severities and confidences are copied back from the rules result unconditionally. Without a model key, nothing is degraded.
Findings, explained
Each dashboard finding states what was measured, what was observed, what was expected and over what window. The model can rephrase; it cannot change a number.
MLR narrative
A deterministic explanation of medical loss ratio movement, attributing change to premium, claims mix and membership.
Churn, decomposed
Disenrollment risk broken into its contributing factors, so outreach targets the factor rather than the score.
Bring a question you cannot answer today.
Bruce will open the analytics portal and work it in front of you, on a population whose numbers you can check.